When a client calls because their peaks don’t line up with the reference pattern, the first thing I ask about is how the sample was loaded. More often than not, the instrument is fine. The sample surface is just not where the diffractometer thinks it is. That’s sample displacement, one of the most common systematic errors in powder diffraction. It doesn’t make your pattern noisy. It quietly shifts every peak, so the data looks clean and is still wrong.
What displacement is
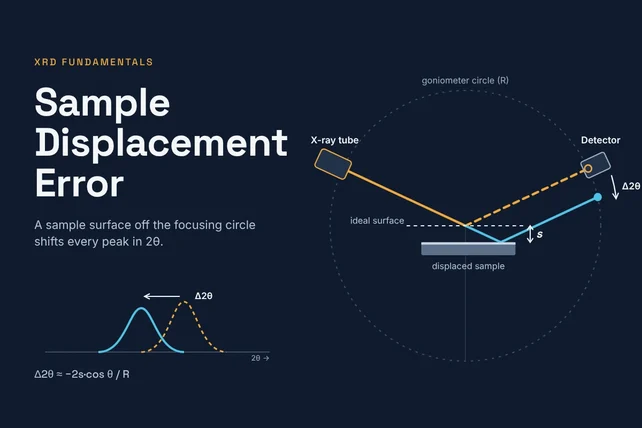
A standard Bragg-Brentano diffractometer is built around the assumption that the surface of the specimen sits exactly on the rotation axis of the goniometer. When the sample surface is on the axis, the diffracted beam arrives at the detector at its correct 2θ. Move either slider (there’s a second one just above the table) to see what happens when it isn’t.
The short version
If your peaks are all off in the same direction, and the error is bigger at low angles than at high angles, check your sample height before you suspect the instrument.
How the math works
If the surface sits a distance s off the axis, the reflection is recorded at the wrong angle. For Bragg-Brentano geometry with a flat specimen, the shift in peak position is [1, 2]
Δ2θ = −2s cos θ / R (1)
where
- Δ2θ: shift of the observed peak from its true position, in radians
- s: displacement of the specimen surface from the goniometer axis, measured along the surface normal (mm). In this post, s is positive when the surface sits below the reference plane.
- θ: Bragg angle, half of the peak’s 2θ position
- R: goniometer radius, the distance from the axis to the tube focus and to the receiving slit (mm, same unit as s)
Equation 1 gives the shift in radians. Multiply by 180/π to get degrees as this is the more practical way to visualize the effect:
Δ2θ (degrees) = (180/π) · Δ2θ = −(360/π) · s cos θ / R (2)
With s positive below the plane, a positive s gives a negative Δ2θ: a sample that sits too low pushes peaks to lower 2θ, and a sample that sits too high (negative s) pushes them to higher 2θ. That’s what the diagram shows. The published form of the equation carries the minus sign but doesn’t spell out which way s points, and software packages don’t all agree: some define the refined displacement with the opposite sign. [3] If you compare a refined displacement between programs, check the convention first.
Three things fall out of that equation:
- The shift scales with displacement. Twice the height error gives twice the shift.
- Shorter goniometers are more sensitive. The same 0.1 mm error shifts peaks about twice as far on a 141 mm benchtop as on a 300 mm floor-standing system.
- The shift depends on angle. Low-angle peaks move the most and the shift shrinks toward high angles. That angle dependence is what distinguishes displacement from a simple zero offset.
To put numbers on it: 0.1 mm of displacement on a 217.5 mm goniometer moves a peak at 35° 2θ by about 0.05°. A 0.22 mm error on a 150 mm instrument moves the same peak by about 0.16°. That’s enough to throw off a lattice parameter or push a search-match result to the wrong phase.
Why it matters
- Wrong lattice parameters. Every d-spacing is off in the same direction, so the refined cell looks expanded or contracted. That can look a lot like a real change in composition, a solid solution, or strain.
- Poor search-match results. If the shift is larger than the tolerance in your phase ID software, minor phases can get missed or misidentified.
- Mismatched comparisons. Two operators loading the same material slightly differently can produce patterns that don’t overlay, and it’s easy to blame the instrument.
Where it comes from
- Overfilled holders. Powder mounded above the rim puts the surface above the plane and shifts peaks high.
- Underfilled or partially filled holders. Powder that doesn’t reach the rim, or that settles and sinks in the middle, puts the surface below the plane and shifts peaks low.
- Holder seating. A holder that isn’t fully seated, a bit of powder or grit on the reference surface, a worn holder, or a holder designed for a different stage can all move the sample surface off the axis.
- Odd specimens. Bulk pieces, pressed pellets, films on substrates, and anything mounted with tape or clay need extra care, because their surface height isn’t set by the holder rim.
- The sample holder itself. We’ve measured hundreds of sample holders and the variability in some designs has been shocking. Don’t ignore the possibility that the holder itself is the problem.
There’s a related error that also shifts peaks low: sample transparency. When X-rays penetrate deep into a weakly absorbing sample (organics, polymers, light-element materials), the effective diffracting surface sits below the physical surface. It behaves differently with angle and calls for different fixes, so I’ll cover it in its own post.
How to spot it
- Check the instrument first. Run a certified flat standard such as NIST SRM 1976c (a sintered corundum plate). If the standard lands where it should and your samples don’t, the problem is in sample prep.
- Use an internal standard. Mix a small amount of a known material, such as silicon (NIST SRM 640 series), into your sample. Both sets of peaks see the same displacement, so the standard tells you how far off you are and lets you correct for it.
- Look at the shape of the error. Plot the difference between observed and expected peak positions against cos θ. A displacement error falls on a line through the origin, with a slope of −2s/R. A goniometer zero error is a constant offset at every angle.
- Refine it. Rietveld and Pawley software (Jade, TOPAS, GSAS-II, HighScore and others) can refine a specimen displacement parameter. It correlates with zero error and with the lattice parameters, so refine it with care, and anchor it with an internal standard when lattice parameters matter.
How to avoid it
- Fill to the rim and level it. Overfill slightly, then strike the surface flat with a glass slide or a straight edge drawn across the holder rim. The surface should be flat and flush, not domed or dished.
- Don’t press harder than you need to. Heavy pressing can introduce preferred orientation. Back-loading or side-loading holders help when that’s a concern.
- Keep holders and stage surfaces clean. Wipe the reference surfaces before you load the holder. A little stray powder under the holder is enough to tilt or lift it.
- Use the right holder for your instrument. Holders are made to put the sample surface at the reference height for a specific stage. A holder from a different system may fit and still sit at the wrong height.
- Use a shallow well for small samples. If you only have a few milligrams, a zero background holder with a shallow well lets you fill to the rim instead of spreading a thin layer at the bottom of a deep cavity. I’ll go into choosing well diameter and depth in another post.
At KSA we make XRD sample holders, including zero background holders in a range of well sizes. You can browse and order them at store.ksanalytical.com. If you’re not sure which holder fits your instrument or your sample, give us a call and we’ll help you sort it out.
References
- McCusker, L. B., Von Dreele, R. B., Cox, D. E., Louër, D. & Scardi, P. (1999). Rietveld refinement guidelines. Journal of Applied Crystallography 32, 36–50. Equation 3 gives the Bragg-Brentano flat-plate correction, Δ2θ = −2s cos θ / R. journals.iucr.org/j/issues/1999/01/00/gl0561
- Parrish, W., Wilson, A. J. C. & Langford, J. I. (2006). X-ray diffraction methods: polycrystalline, Table 5.2.4.1, specimen displacement. In International Tables for Crystallography, Vol. C, ed. E. Prince, ch. 5.2, p. 494. For the symmetrical arrangement its general expression reduces to Equation 1. it.iucr.org/Cb/ch5o2v0001/table5o2o4o1
- Crystal Impact, Match! manual, Specimen displacement correction, which notes that the correction runs in opposite directions in Match! and FullProf. crystalimpact.com/match/help/idh_rawdata-proc_specidisp.htm
- National Institute of Standards and Technology. Standard Reference Material 1976c, Certificate of Analysis. Certified lattice parameters (Table 2), relative intensities (Table 1) and Cu Kα₁ peak positions (Table 3).
Pattern note: the graphic mimics a scan of the NIST SRM 1976c corundum plate. Peak positions come from the certified lattice parameters, and the certified reflections (012, 104, 113, 024, 116, 300, 1 0 10 + 119 and 0 2 10) use the relative intensities in the certificate’s Table 1, measured with a Johansson incident-beam monochromator. The plate is textured, so these differ from a randomly oriented powder (113 and 300 come out noticeably weaker). The 1 0 10 and 119 pair is certified as one value and is split here using the crystal structure. Reflections the certificate doesn’t list, such as 110, 006, 018 and 214, are estimates from the corundum crystal structure (Kirfel & Eichhorn, 1990) with a texture correction fitted to the certified values, and are marked * on the pattern.